Tutorial Author Micah’: Micah Sandusky
Tutorial Author Micah_o: Micah Johnson
SnowEx has introduced a unique opportunity to study SWE in a way that’s unprecedented, but with more data comes new challenges.
The SnowEx database is a resource that shortcuts the time it takes to ask cross dataset questions
Standardizing diverse data
Cross referencing data
Provenance!
Added GIS functionality
Connect w/ ArcGIS or QGIS!
CITABLE
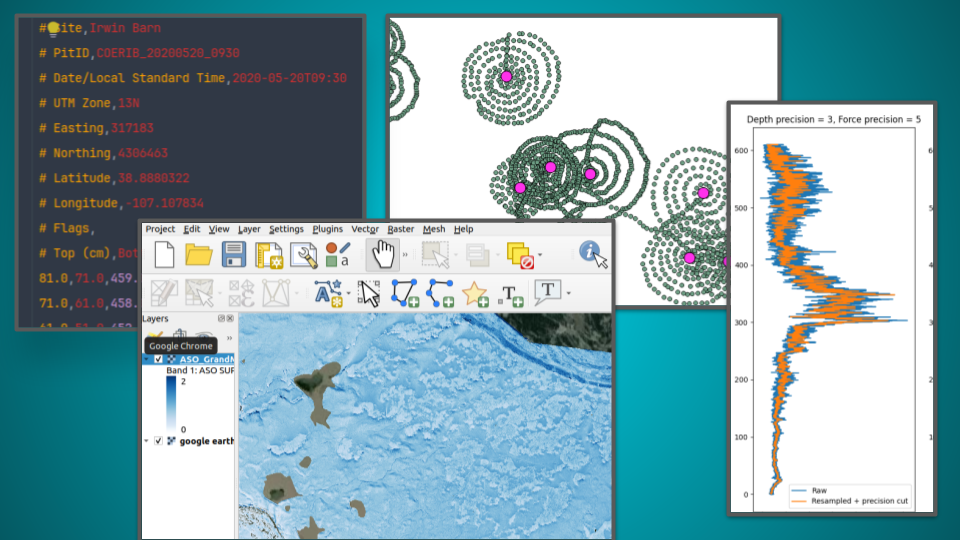
What’s in it?
Snow pits - Density, hardness profiles, grain types + sizes
Manual snow depths - TONS of depths (Can you say spirals?)
Snow Micropenetrometer (SMP) profiles - (Subsampled to every 100th)
Snow depth + SWE rasters from ASO Inc.
GPR
Pit site notes
Camera Derived snow depths
Snow off DEM from USGS 3DEP
And almost all the associated metadata
Technically, what is it?
PostgreSQL database
PostGIS extension
Supports vector and raster data
And a host of GIS operations
AND NOW WITH API!
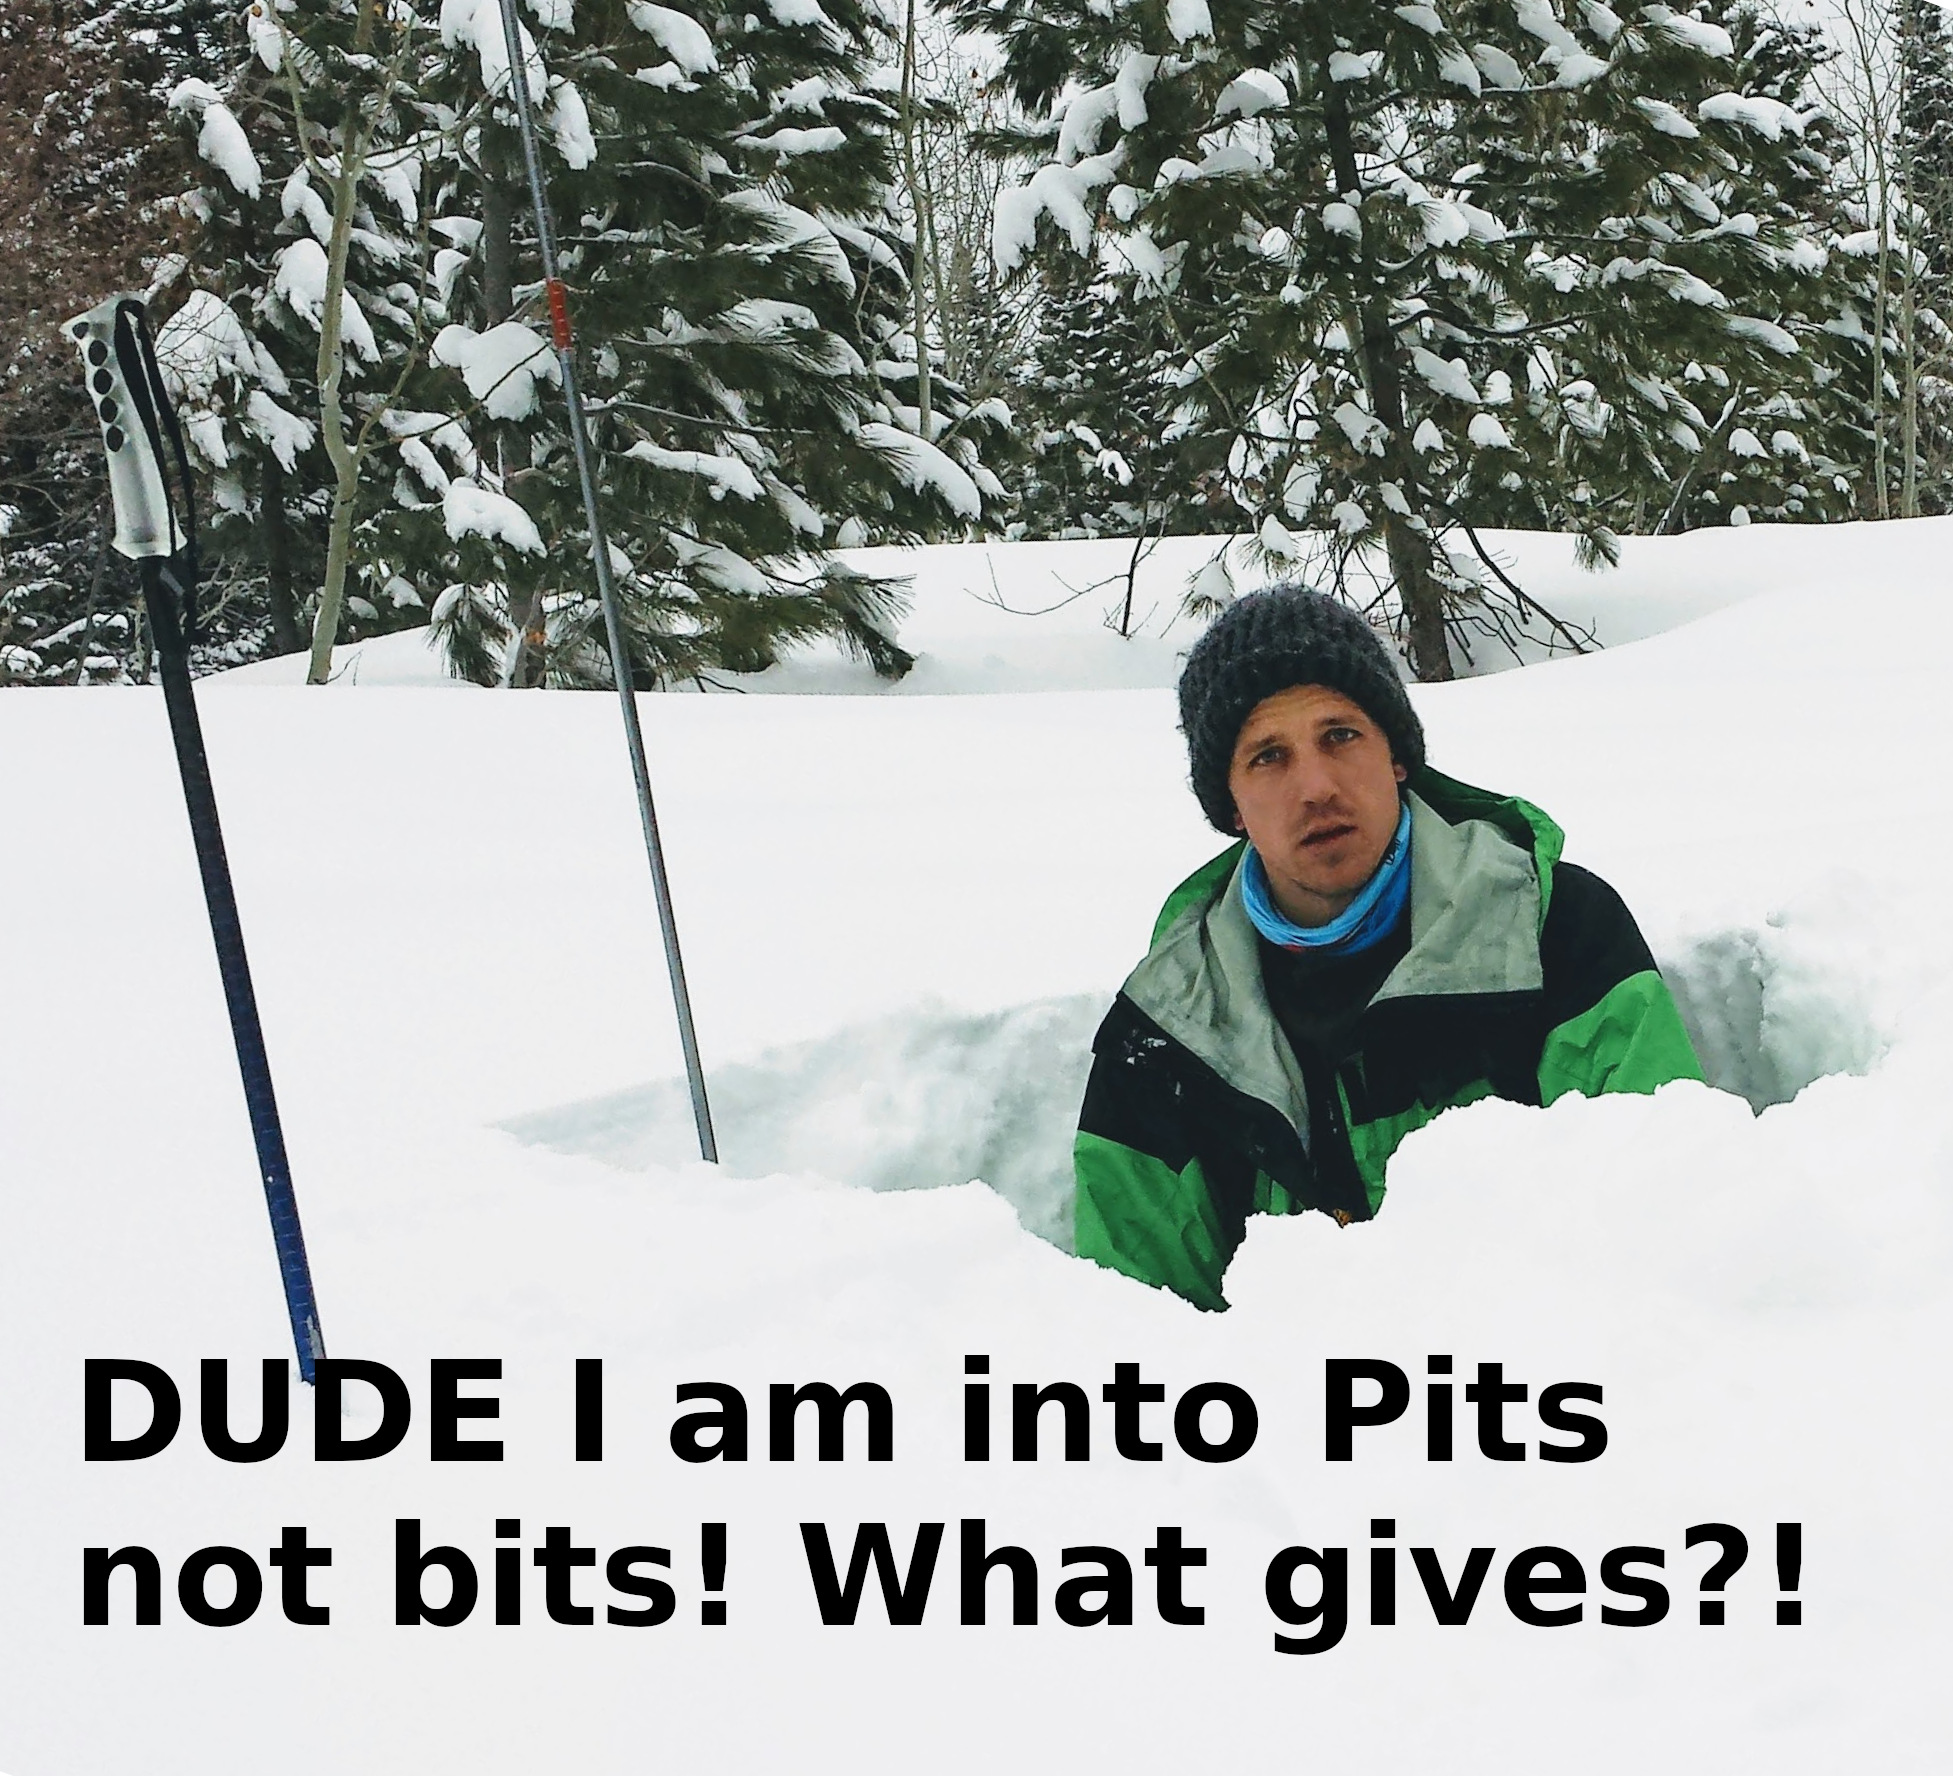
So what’s the catch?
New tech can create barriers...
TL;DR Do less wrangling, do more crunching.
from snowexsql.api import PointMeasurements

df = PointMeasurements.from_filter(type="depth", instrument='pit ruler', limit=100)
df.plot(column='value', cmap='jet', vmin=10, vmax=150)
dfOld Ways / Advanced Users
Advanced queries can be made using SQL or SQAlchemy under the hood.
See previous presentations
Engine objects, session objects, and a crash course in ORM, oh my!
How is the Database Structured?
The goal of the database is to hold as much of the SnowEx data in one place and make it easier to do research with. With that in mind follow the steps below to see how the the data base is structured.
Where do datasets live (i.e. tables)?
Data in the database lives in 1 of 4 places.
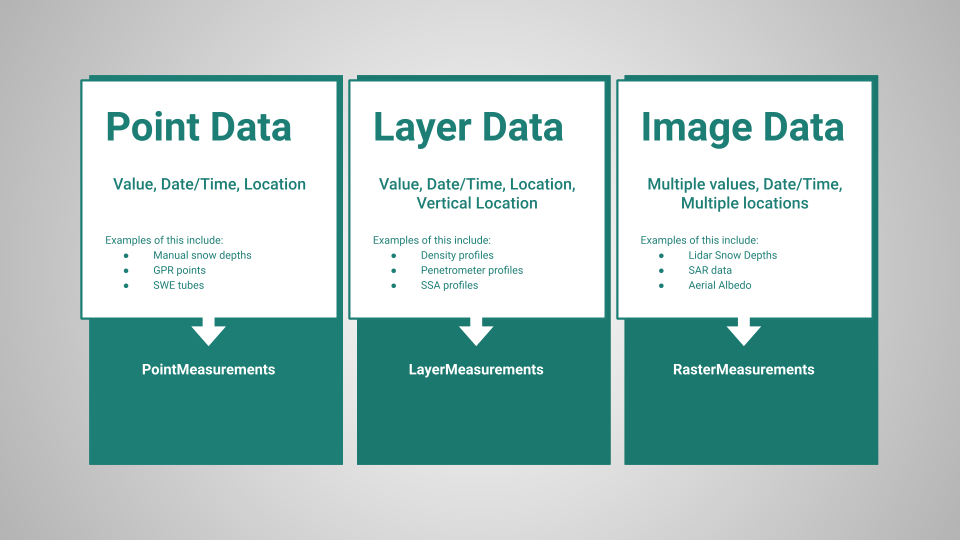
Layout of the database tables
The 4th table is a table detailing the site information. Lots and lots of metadata for which the API has not been written yet.
So how does this look in python?
from snowexsql.api import PointMeasurements, LayerMeasurements, RasterMeasurementsHow are tables structured?
Each table consists of rows and columns. Below are the available columns!
# Import the class reflecting the points table in the db
from snowexsql.api import PointMeasurements as measurements

# Grab one measurement to see what attributes are available
df = measurements.from_filter(type="depth", limit=1)

# Print out the results nicely
print("These are the available columns in the table:\n \n* {}\n".format('\n* '.join(df.columns)))
These are the available columns in the table:
* version_number
* equipment
* value
* latitude
* longitude
* northing
* easting
* elevation
* utm_zone
* geom
* time
* site_id
* site_name
* date
* time_created
* time_updated
* id
* doi
* date_accessed
* instrument
* type
* units
* observers
Try this: Using what we just did, but swap out PointMeasurements for LayerMeasurements.
Question: Did you collect any data? What is it? What table do you think it would go in?
For more detail, checkout the readthedocs page on database structure to see how data gets categorized.
Bonus Step: Learning to help yourself
snowexsql has a host of resources for you to help your self. First when you are looking for something be sure to check the snowexsql’s docs. There you will find notes on the database structure. datasets, and of course our new API!
Database Usage/Examples
Database Building/Notes
Recap
You just explored the database structure and discussed how they differ.
You should know:
Which table a dataset might live in
What columns you can work with (or how to get the available columns)
Some resources to begin helping yourself.
If you don’t feel comfortable with these, you are probably not alone, let’s discuss it!
Forming Queries through the API!
Get familiar with the tools available for querying the database. The simplest way is to use the api classes
Each class has to very useful functions
Useful Function - from_filter
Use the from filter function to find density profiles
# Import in our two classes to access the db
from snowexsql.api import LayerMeasurements
from datetime import datetime

# Find some density pit measurements at the Boise site in december 2019.
df = LayerMeasurements.from_filter(
    type="density",
    site_name="Boise River Basin",
    date_less_equal=datetime(2020, 1, 1),
    date_greater_equal=datetime(2019, 12, 1),
)

# Plot Example!
df.plot()

# Show off the dataframe
df

# Analysis Example - Find the bulk density
df['value'] = df['value'].astype(float)
print(df[['site_id', 'value']].groupby(by='site_id').mean())
value
site_id
Banner Open 235.500000
Banner Snotel 216.666667
Bogus Upper 260.625000
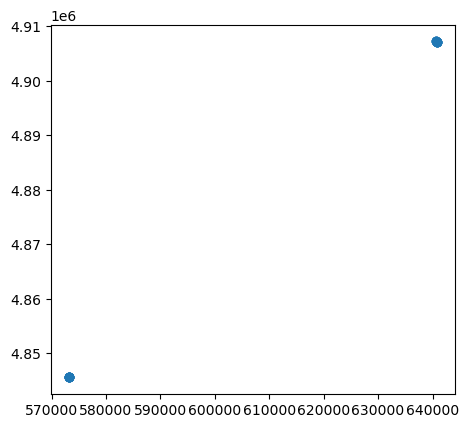
Useful Function - from_area
Find specific surface area within a certain distance of a pit.
# Import our api class
from snowexsql.api import LayerMeasurements
from datetime import datetime
import geopandas as gpd

# import some gis functionality
from shapely.geometry import Point

# Find some SSA measurements within a distance of a known point
pnt = Point(740820.624625,4.327326e+06)
df = LayerMeasurements.from_area(pt=pnt, crs=26912, buffer=500,
    type='specific_surface_area')

# plot up the results
ax = df.plot()

# plot the site so we can see how close everything is.
site = gpd.GeoDataFrame(geometry=[pnt], crs=26912)
site.plot(ax=ax, marker='^', color='magenta')

# show off the dataframe
dfHow do I know what to filter on?
We got tools for that! Each class has a host of functions that start with all_* these function return the unique value in that column.
all_types- all the data types e.g. depth, swe, density...all_instruments- all instruments available in the tableall_dates- all dates listed in the tableall_site_names- all the site names available in the table. e.g. Grand Mesa
from snowexsql.api import PointMeasurements

# Instantiate the class to use the properties!
measurements = PointMeasurements()

# Get the unique data names/types in the table
results = measurements.all_types
print('Available types = {}'.format(', '.join([str(r) for r in results])))

# Get the unique instrument in the table
results = measurements.all_instruments
print('\nAvailable Instruments = {}'.format(', '.join([str(r) for r in results])))

# Get the unique dates in the table
results = measurements.all_dates
print('\nAvailable Dates = {}'.format(', '.join([str(r) for r in results])))

# Get the unique site names in the table
results = measurements.all_site_names
print('\nAvailable sites = {}'.format(', '.join([str(r) for r in results])))
Available types = two_way_travel, snow_void, density, swe, depth
Available Instruments = mesa, magnaprobe, camera, pulseEkko pro 1 GHz GPR, None, Mala 1600 MHz GPR, Mala 800 MHz GPR, pulse EKKO Pro multi-polarization 1 GHz GPR, pit ruler
Available Dates = 2020-05-28, 2020-01-09, 2021-03-19, 2020-05-23, 2019-11-29, 2020-01-04, 2019-10-20, 2019-11-30, 2021-01-28, 2020-04-17, 2021-02-19, 2020-02-19, 2020-02-26, 2020-02-03, 2020-05-05, 2019-10-05, 2019-12-29, 2020-06-02, 2019-10-28, 2020-01-30, 2020-05-22, 2020-03-09, 2019-12-09, 2019-12-28, 2020-02-24, 2020-03-17, 2021-03-18, 2020-04-01, 2020-05-14, 2019-10-14, 2019-10-29, 2019-10-02, 2020-01-31, 2020-04-18, 2020-04-26, 2019-10-12, 2020-04-29, 2021-03-03, 2020-02-23, 2021-01-15, 2020-01-22, 2020-01-01, 2019-11-21, 2020-05-10, 2023-03-13, 2020-02-12, 2019-11-19, 2020-05-06, 2019-10-25, 2019-11-02, 2020-02-08, 2020-04-14, 2020-04-02, 2019-11-16, 2020-04-07, 2021-03-21, 2021-04-21, 2023-03-15, 2020-11-25, 2019-12-27, 2019-10-01, 2021-01-27, 2020-04-16, 2020-06-08, 2019-12-13, 2019-10-17, 2019-10-22, 2021-01-22, 2020-04-21, 2020-01-03, 2019-12-12, 2019-12-08, 2021-03-05, 2020-01-25, 2020-02-29, 2019-11-24, 2019-10-18, 2021-03-04, 2021-03-24, 2021-03-16, 2020-05-09, 2020-03-22, 2019-11-06, 2019-12-16, 2020-01-15, 2019-11-22, 2019-10-13, 2019-11-10, 2019-12-06, 2020-02-04, 2019-10-31, 2020-03-07, 2020-04-06, 2020-05-03, 2019-12-10, 2020-05-26, 2019-12-02, 2021-02-09, 2020-02-14, 2020-02-13, 2020-05-11, 2019-12-01, 2020-01-19, 2019-11-28, 2020-01-17, 2019-12-17, 2021-02-17, 2021-01-07, 2021-03-31, 2019-12-25, 2019-12-14, 2019-10-24, 2020-02-01, 2020-03-11, 2021-03-23, 2020-02-09, 2020-05-12, 2020-05-25, 2020-03-29, 2020-04-24, 2019-12-11, 2020-01-10, 2020-06-05, 2019-10-10, 2020-11-20, 2020-04-13, 2020-03-23, 2020-04-23, 2020-05-24, 2019-11-08, 2021-05-05, 2019-12-26, 2019-12-15, 2021-04-06, 2020-05-07, 2021-01-20, 2020-02-28, 2019-11-03, 2020-04-04, 2019-11-27, 2021-01-14, 2020-03-15, 2019-11-23, 2020-01-16, 2019-10-08, 2023-03-14, 2019-11-14, 2020-02-15, 2020-02-11, 2023-03-12, 2019-11-13, 2020-04-30, 2019-10-26, 2020-03-06, 2021-03-17, 2020-05-31, 2020-03-04, 2021-02-24, 2019-10-04, 2020-05-16, 2020-04-03, 2019-10-06, 2019-10-09, 2021-02-25, 2020-03-12, 2019-11-12, 2019-11-01, 2020-03-10, 2019-10-30, 2020-02-21, 2020-12-17, 2020-06-01, 2020-03-20, 2023-03-07, 2020-03-03, 2019-11-07, 2020-01-06, 2019-12-22, 2021-02-11, 2020-01-11, 2019-11-11, 2019-11-05, 2020-01-13, 2023-03-16, 2019-12-18, 2019-12-30, 2020-05-04, 2020-04-20, 2021-04-14, 2023-03-09, 2023-03-08, 2020-02-22, 2020-05-08, 2019-12-24, 2020-12-18, 2020-01-24, 2020-04-22, 2019-11-04, 2020-03-31, 2020-01-08, 2020-02-06, 2021-02-18, 2020-03-05, 2021-05-27, 2020-03-14, 2021-02-04, 2020-06-09, 2021-01-21, 2020-02-20, 2020-11-23, 2020-04-05, 2020-06-03, 2019-10-16, 2021-05-07, 2020-04-15, 2021-01-26, 2019-12-03, 2020-05-30, 2019-11-09, 2021-02-16, 2020-04-28, 2020-01-12, 2020-05-20, 2023-03-10, 2020-05-02, 2020-01-28, 2020-02-05, 2020-01-21, 2019-12-19, 2019-10-07, 2020-03-28, 2020-02-10, 2021-04-28, 2020-03-02, 2019-09-29, 2019-11-15, 2020-01-02, 2020-05-27, 2020-02-18, 2019-10-11, 2019-12-21, 2019-09-30, 2021-03-10, 2020-04-09, 2020-01-05, 2019-10-27, 2020-04-10, 2021-04-23, 2020-03-16, 2020-03-21, 2020-02-02, 2020-02-25, 2020-04-08, 2020-01-29, 2019-12-04, 2021-03-22, 2021-02-10, 2021-02-03, 2019-11-26, 2020-03-19, 2020-01-20, 2019-12-31, 2020-02-27, 2020-03-30, 2020-04-25, 2020-01-26, 2020-01-14, 2020-12-08, 2020-03-01, 2020-02-17, 2020-05-21, 2019-10-23, 2021-03-02, 2020-04-11, 2019-10-21, 2020-12-16, 2019-11-25, 2020-04-12, 2020-03-13, 2020-05-01, 2021-05-20, 2020-03-08, 2021-01-13, 2020-05-19, 2020-03-27, 2019-11-17, 2020-04-19, 2020-01-23, 2020-05-15, 2021-02-23, 2020-02-16, 2019-10-19, 2020-05-29, 2020-03-24, 2019-12-07, 2020-02-07, 2020-03-18, 2020-05-17, 2020-05-13, 2019-12-20, 2019-12-23, 2020-06-07, 2020-01-07, 2020-05-18, 2021-05-17, 2021-04-07, 2019-12-05, 2019-11-20, 2020-06-06, 2020-12-09, 2023-03-11, 2021-02-02, 2019-11-18, 2020-06-10, 2020-01-27, 2020-11-16, 2020-01-18, 2020-06-04, 2020-04-27, 2019-10-15, 2020-12-01, 2020-03-25, 2020-03-26, 2019-10-03, 2021-03-09
Available sites = American River Basin, Central Ag Research Center, Senator Beck, farmers-creamers, Fairbanks, None, Fraser Experimental Forest, Boise River Basin, Little Cottonwood Canyon, East River, North Slope, Jemez River, Grand Mesa, Cameron Pass, Sagehen Creek, Mammoth Lakes, Niwot Ridge
More specific filtering options
Sometimes we need a bit more filtering to know more about what I can filter on. Questions like “What dates was the SMP used?” are a bit more complicated than “Give me all the dates for snowex”
The good news is, we have tool for that! from_unique_entries is your friend!
# import layer measurements
from snowexsql.api import LayerMeasurements

# Query dates where SMP was used
LayerMeasurements.from_unique_entries(['date'], instrument='snowmicropen')
[datetime.date(2020, 2, 4),
datetime.date(2020, 2, 3),
datetime.date(2020, 1, 30),
datetime.date(2020, 2, 1),
datetime.date(2020, 2, 6),
datetime.date(2020, 1, 31),
datetime.date(2020, 2, 12),
datetime.date(2020, 2, 8),
datetime.date(2020, 2, 5),
datetime.date(2020, 1, 28),
datetime.date(2020, 2, 11),
datetime.date(2020, 2, 10),
datetime.date(2020, 1, 29)]Query Nuances
Limit size
To avoid accidental large queries, we have added some bumper rails. By default if you ask for more than 1000 records then an error will pop up unless you explicitly say you want more.
Try This: Do a large query. Run the code block below without the limit keyword argument (“kwarg”):
# Import PointMeasurements
from snowexsql.api import PointMeasurements

# Query db using a vague filter or on a huge dataset like GPR but remove the limit kwarg
df = PointMeasurements.from_filter(type='two_way_travel', limit=100)

# Show the dataframe
df
We have added this on the db to allow you to explore without accidentally pulling the entire SnowEx universe down. If you know you want a large query (defined as > 1000) then use the limit = #### option in the from_filter or from_area function.
Warning - It is better to filter using other things besides the limit because the limit is not intelligent. It will simply limit the query by the order of entries that were submitted AND fits your filter. So if you encounter this then consider how to tighten up the filter.
List of Criteria
You can use lists in your requests too!
# Import layer measurements
from snowexsql.api import LayerMeasurements

# Grab all the data that used the one of these instruments (hint hint SSA)
ssa_instruments = ["IS3-SP-15-01US", "IRIS",  "IS3-SP-11-01F"]

# Query the DB (throw a limit for safety)
LayerMeasurements.from_filter(instrument=ssa_instruments, limit=100)Greater than or Less than
Sometimes we want to isolate certain ranges of value or even dates. The greater_equal and less_equal terms can be added on to value or dates.
date_greater_equaldate_less_equalvalue_greater_equalvalue_less_equal
# Import the point measurements class
from snowexsql.api import PointMeasurements

# Filter values > 100 cm from the pulse ecko GPR
df = PointMeasurements.from_filter(value_greater_equal=100, type='depth', instrument='pulse EKKO Pro multi-polarization 1 GHz GPR', limit=100)

# Show off the dataframe
dfRecap
You just came in contact with the new API tools. We can use each API class to pull from specific tables and filter the data. You should know:
How to build queries using
from_filter,from_area,from_unique_entriesDetermine what values to filter on
Manage the limit error
Filtering on greater and less than
If you don’t feel comfortable with these, you are probably not alone, let’s discuss it!
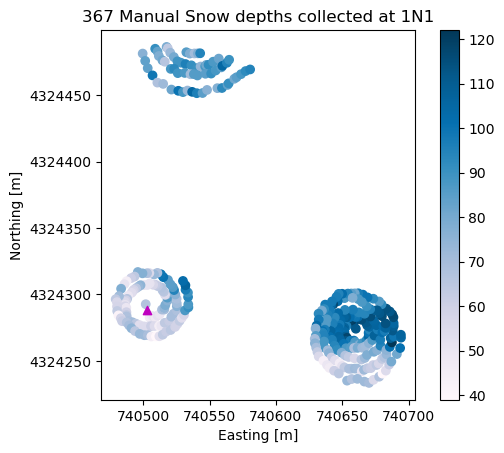
Exercise: Visualize a Manual Depth Spiral
During the SnowEx campaigns a TON of manual snow depths were collected, past surveys for hackweek showed an overhelming interest in the manual snow depths dataset. This tutorial shows how easy it is to get at that data in the database while learning how to build queries
Goal: Visualize a small subset of snow depth, ideally a full spiral (mostly cause they are cool!)
Approach:
Determine the necessary details for isolating manual depths
Find a pit where many spirals were done.
Buffer on the pit location and grab all manual snow depths
Process
from snowexsql.api import LayerMeasurements
data_type = 'depth'
Step 1: Find a pit of interest
# Pick the first one we find
site_id = LayerMeasurements().all_site_ids[0]

# Query the database, we only need one point to get a site id and its geometry
site_df = LayerMeasurements.from_filter(site_id=site_id, limit=1)

# Print it out
site_dfStep 2: Collect Snow Depths
# We import the points measurements because snow depths is a single value at single location and date
from snowexsql.api import PointMeasurements

# Filter the results to within 100m within the point from our pit
df = PointMeasurements.from_area(pt=site_df.geometry[0], type=data_type, buffer=200)
dfStep 3: Plot it!
# Get the Matplotlib Axes object from the dataframe object, color the points by snow depth value
ax = df.plot(column='value', legend=True, cmap='PuBu')
site_df.plot(ax=ax, marker='^', color='m')

# Use non-scientific notation for x and y ticks
ax.ticklabel_format(style='plain', useOffset=False)

# Set the various plots x/y labels and title.
ax.set_title(f'{len(df.index)} Manual Snow depths collected at {site_id}')
ax.set_xlabel('Easting [m]')
ax.set_ylabel('Northing [m]');
Try This:
A. Go back and add a filter to reduce to just one spiral. What would you change to reduce this?
B. Try to filtering to add more spirals. What happens?
Recap
You just plotted snow depths and reduce the scope of the data by using from_area on it
You should know:
Manual depths are neat.
filter using from area is pretty slick.
We can use LayerMeasurements to get site details easily.
If you don’t feel comfortable with these, you are probably not alone, let’s discuss it!